> ## Documentation Index
> Fetch the complete documentation index at: https://bun-1dd33a4e-farm-ad2450b3-transpiler-cache-version-namespa.mintlify.site/llms.txt
> Use this file to discover all available pages before exploring further.
# Benchmarking
> How to benchmark Bun
Bun is designed for speed. Hot paths are extensively profiled and benchmarked. The source code for all of Bun's public benchmarks is in the [`/bench`](https://github.com/oven-sh/bun/tree/main/bench) directory of the Bun repo.
## Measuring time
To measure time precisely, Bun offers two runtime APIs:
1. The Web-standard [`performance.now()`](https://developer.mozilla.org/en-US/docs/Web/API/Performance/now) function
2. `Bun.nanoseconds()`, which is like `performance.now()` except it returns the time since the application started in nanoseconds. Use `performance.timeOrigin` to convert this to a Unix timestamp.
## Benchmarking tools
* For microbenchmarks, we recommend [`mitata`](https://github.com/evanwashere/mitata).
* For load testing, you *must use* an HTTP benchmarking tool that is at least as fast as `Bun.serve()`, or your results will be skewed. Some popular Node.js-based benchmarking tools like [`autocannon`](https://github.com/mcollina/autocannon) are not fast enough. We recommend one of the following:
* [`bombardier`](https://github.com/codesenberg/bombardier)
* [`oha`](https://github.com/hatoo/oha)
* [`http_load_test`](https://github.com/uNetworking/uSockets/blob/master/examples/http_load_test.c)
* For benchmarking scripts or CLI commands, we recommend [`hyperfine`](https://github.com/sharkdp/hyperfine).
## Measuring memory usage
Bun has two heaps: one for the JavaScript runtime, and one for everything else.
### JavaScript heap stats
The `bun:jsc` module exposes a few functions for measuring memory usage:
```ts theme={"theme":{"light":"github-light","dark":"dracula"}}
import { heapStats } from "bun:jsc";
console.log(heapStats());
```
```ts expandable icon="https://mintcdn.com/bun-1dd33a4e-farm-ad2450b3-transpiler-cache-version-namespa/pVrMBuZvntvIe2NO/icons/typescript.svg?fit=max&auto=format&n=pVrMBuZvntvIe2NO&q=85&s=81fcaf3ac2cead5d758f3588a492f46a" theme={"theme":{"light":"github-light","dark":"dracula"}}
{
heapSize: 1657575,
heapCapacity: 2872775,
extraMemorySize: 598199,
objectCount: 13790,
protectedObjectCount: 62,
globalObjectCount: 1,
protectedGlobalObjectCount: 1,
// A count of every object type in the heap
objectTypeCounts: {
CallbackObject: 25,
FunctionExecutable: 2078,
AsyncGeneratorFunction: 2,
'RegExp String Iterator': 1,
FunctionCodeBlock: 188,
ModuleProgramExecutable: 13,
String: 1,
UnlinkedModuleProgramCodeBlock: 13,
JSON: 1,
AsyncGenerator: 1,
Symbol: 1,
GetterSetter: 68,
ImportMeta: 10,
DOMAttributeGetterSetter: 1,
UnlinkedFunctionCodeBlock: 174,
RegExp: 52,
ModuleLoader: 1,
Intl: 1,
WeakMap: 4,
Generator: 2,
PropertyTable: 95,
'Array Iterator': 1,
JSLexicalEnvironment: 75,
UnlinkedFunctionExecutable: 2067,
WeakSet: 1,
console: 1,
Map: 23,
SparseArrayValueMap: 14,
StructureChain: 19,
Set: 18,
'String Iterator': 1,
FunctionRareData: 3,
JSGlobalLexicalEnvironment: 1,
Object: 481,
BigInt: 2,
StructureRareData: 55,
Array: 179,
AbortController: 2,
ModuleNamespaceObject: 11,
ShadowRealm: 1,
'Immutable Butterfly': 103,
Primordials: 1,
'Set Iterator': 1,
JSGlobalProxy: 1,
AsyncFromSyncIterator: 1,
ModuleRecord: 13,
FinalizationRegistry: 1,
AsyncIterator: 1,
InternalPromise: 22,
Iterator: 1,
CustomGetterSetter: 65,
Promise: 19,
WeakRef: 1,
InternalPromisePrototype: 1,
Function: 2381,
AsyncFunction: 2,
GlobalObject: 1,
ArrayBuffer: 2,
Boolean: 1,
Math: 1,
CallbackConstructor: 1,
Error: 2,
JSModuleEnvironment: 13,
WebAssembly: 1,
HashMapBucket: 300,
Callee: 3,
symbol: 37,
string: 2484,
Performance: 1,
ModuleProgramCodeBlock: 12,
JSSourceCode: 13,
JSPropertyNameEnumerator: 3,
NativeExecutable: 290,
Number: 1,
Structure: 1550,
SymbolTable: 108,
GeneratorFunction: 2,
'Map Iterator': 1
},
protectedObjectTypeCounts: {
CallbackConstructor: 1,
BigInt: 1,
RegExp: 2,
GlobalObject: 1,
UnlinkedModuleProgramCodeBlock: 13,
HashMapBucket: 2,
Structure: 41,
JSPropertyNameEnumerator: 1
}
}
```
JavaScript is a garbage-collected language, not reference counted. It's normal and correct for objects to not be freed immediately in all cases, though it's not normal for objects to never be freed.
To force garbage collection to run manually:
```ts theme={"theme":{"light":"github-light","dark":"dracula"}}
Bun.gc(true); // synchronous
Bun.gc(false); // asynchronous
```
Heap snapshots show which objects are not being freed. Use the `bun:jsc` module to take a heap snapshot, then view it with Safari or WebKit GTK developer tools. To generate a heap snapshot:
```ts theme={"theme":{"light":"github-light","dark":"dracula"}}
import { generateHeapSnapshot } from "bun";
const snapshot = generateHeapSnapshot();
await Bun.write("heap.json", JSON.stringify(snapshot, null, 2));
```
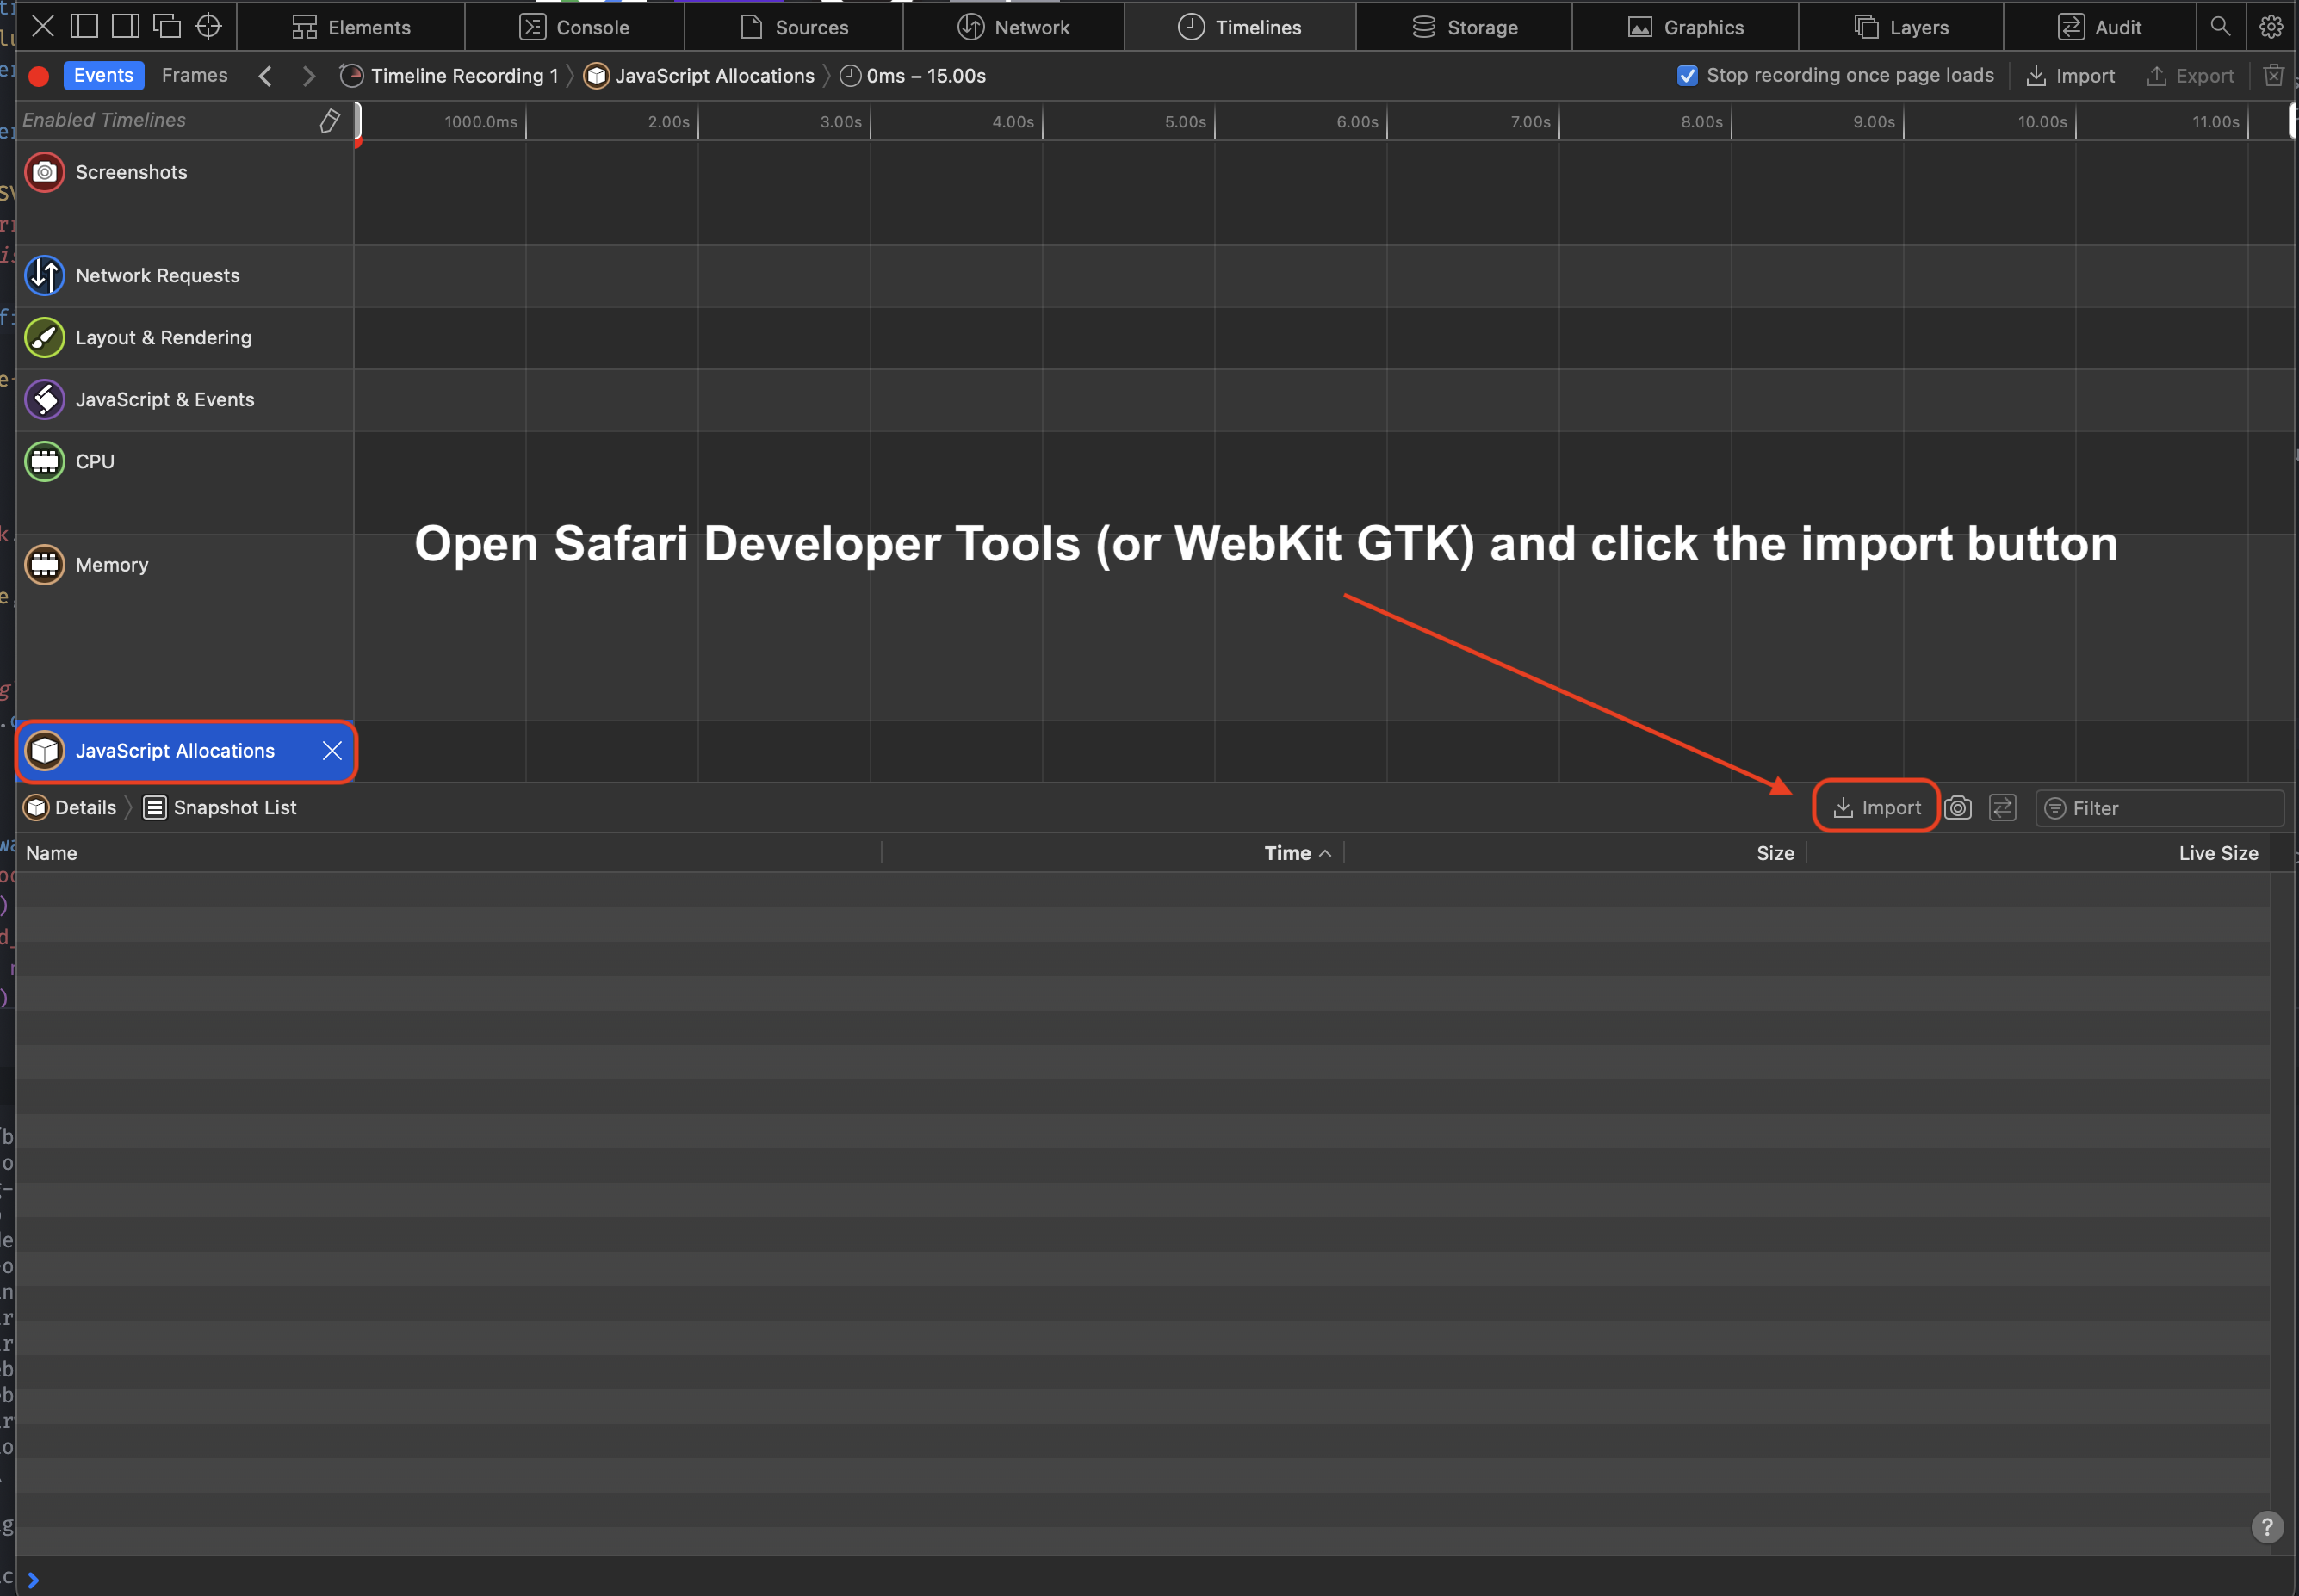
To view the snapshot, open the `heap.json` file in Safari's Developer Tools (or WebKit GTK):
1. Open the Developer Tools
2. Click "Timeline"
3. Click "JavaScript Allocations" in the menu on the left. It might not be visible until you click the pencil icon to show all the timelines
4. Click "Import" and select your heap snapshot JSON
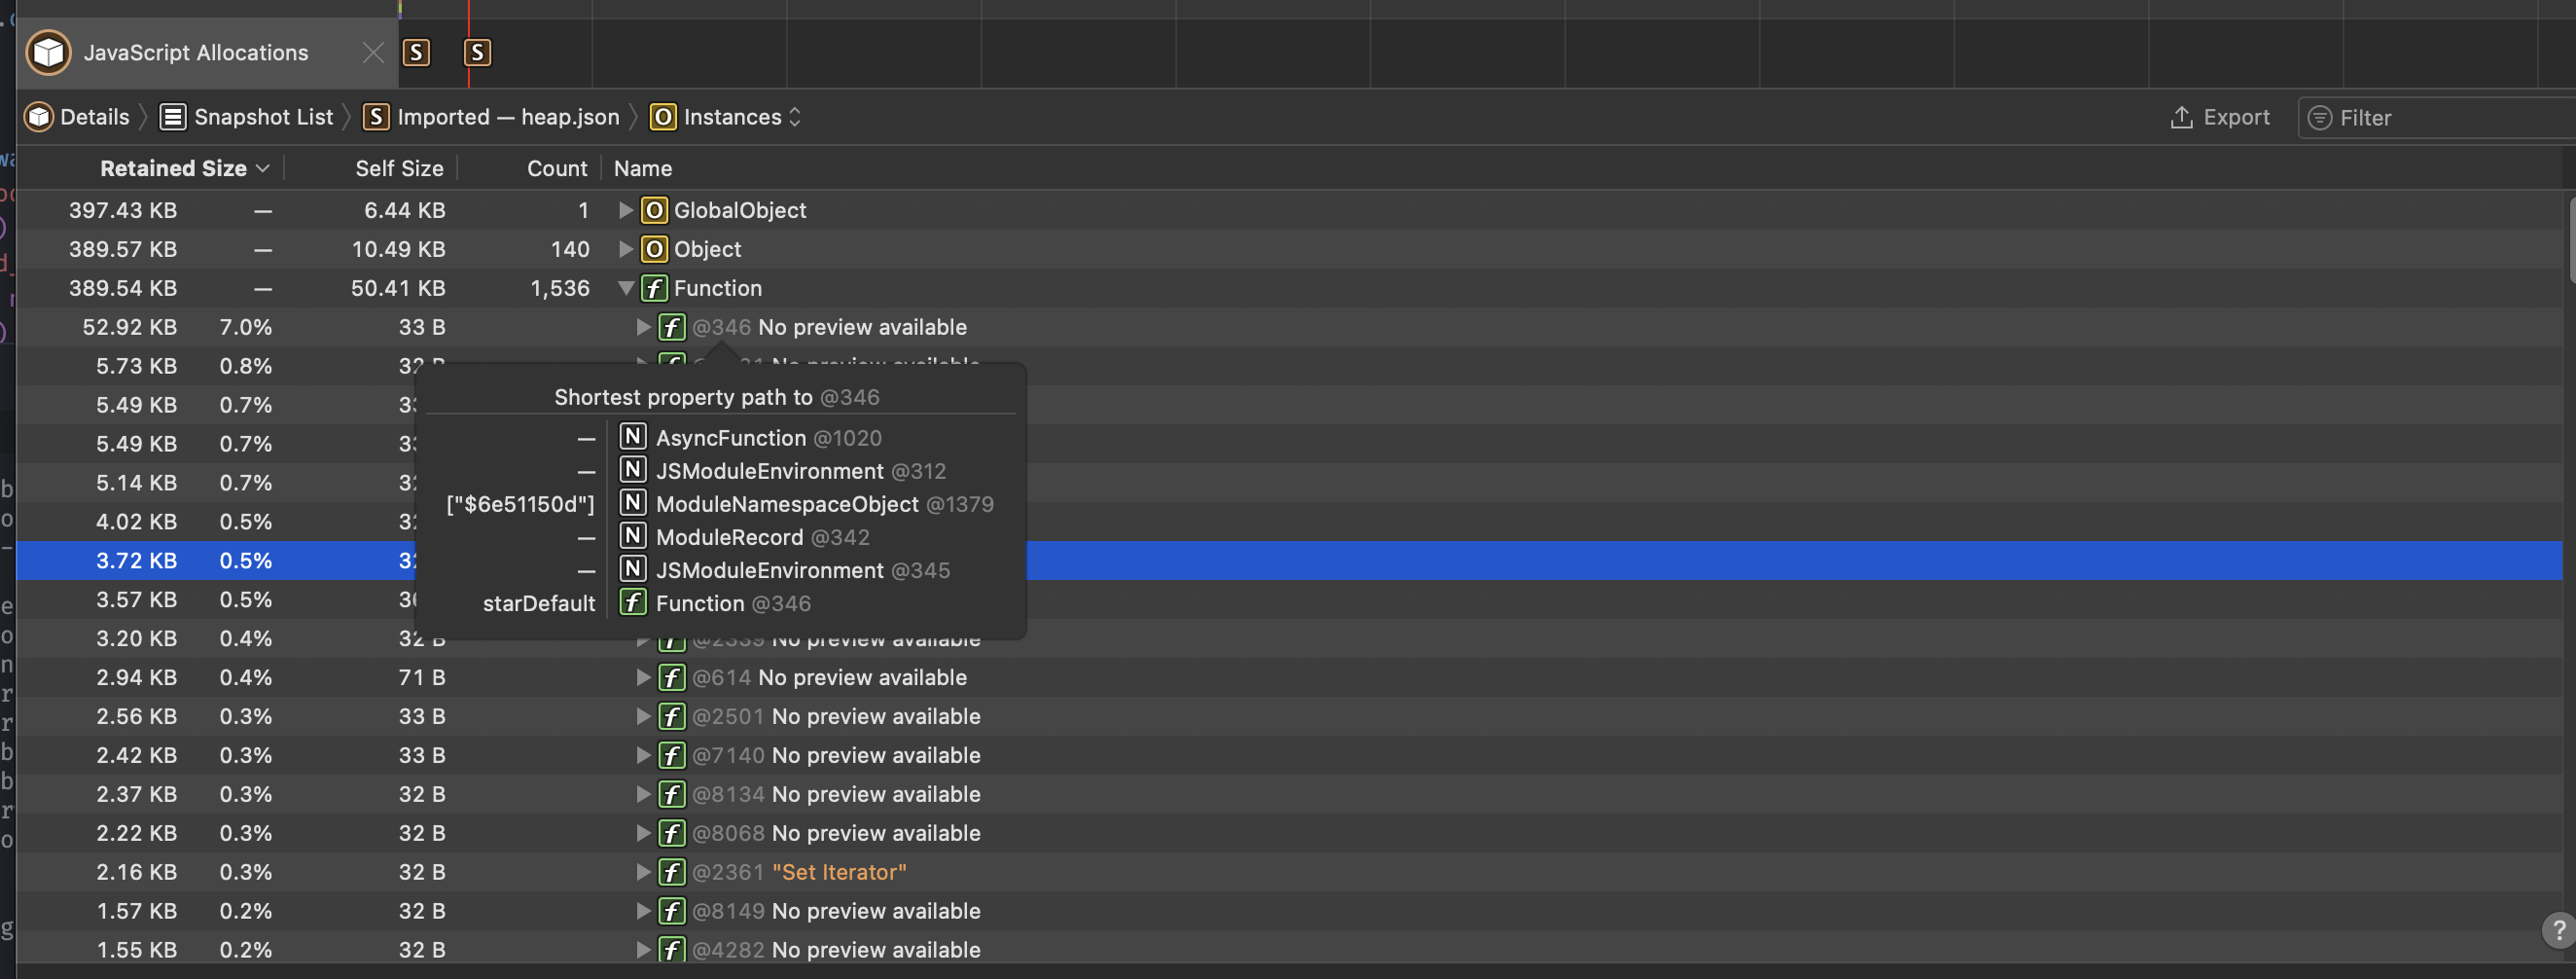
 Once imported, you should see something like this:
 > The [web debugger](/runtime/debugger#inspect) timeline also tracks the memory usage of the running debug session.
### Native heap stats
Bun uses mimalloc for the other heap. To print a summary of non-JavaScript memory usage on exit, set the `MIMALLOC_SHOW_STATS=1` environment variable.
```sh terminal icon="terminal" theme={"theme":{"light":"github-light","dark":"dracula"}}
MIMALLOC_SHOW_STATS=1 bun script.js
```
```txt theme={"theme":{"light":"github-light","dark":"dracula"}}
heap stats: peak total freed current unit count
reserved: 64.0 MiB 64.0 MiB 0 64.0 MiB not all freed!
committed: 64.0 MiB 64.0 MiB 0 64.0 MiB not all freed!
reset: 0 0 0 0 ok
touched: 128.5 KiB 128.5 KiB 5.4 MiB -5.3 MiB ok
segments: 1 1 0 1 not all freed!
-abandoned: 0 0 0 0 ok
-cached: 0 0 0 0 ok
pages: 0 0 53 -53 ok
-abandoned: 0 0 0 0 ok
-extended: 0
-noretire: 0
mmaps: 0
commits: 0
threads: 0 0 0 0 ok
searches: 0.0 avg
numa nodes: 1
elapsed: 0.068 s
process: user: 0.061 s, system: 0.014 s, faults: 0, rss: 57.4 MiB, commit: 64.0 MiB
```
## CPU profiling
Profile JavaScript execution to identify performance bottlenecks with the `--cpu-prof` flag.
```sh terminal icon="terminal" theme={"theme":{"light":"github-light","dark":"dracula"}}
bun --cpu-prof script.js
```
`--cpu-prof` writes a `.cpuprofile` file you can open in Chrome DevTools (Performance tab → Load profile) or VS Code's CPU profiler.
### Markdown output
Use `--cpu-prof-md` to generate a markdown CPU profile, which is grep-friendly and designed for LLM analysis:
```sh terminal icon="terminal" theme={"theme":{"light":"github-light","dark":"dracula"}}
bun --cpu-prof-md script.js
```
Combine `--cpu-prof` and `--cpu-prof-md` to generate both formats at once:
```sh terminal icon="terminal" theme={"theme":{"light":"github-light","dark":"dracula"}}
bun --cpu-prof --cpu-prof-md script.js
```
You can also pass the flag through the `BUN_OPTIONS` environment variable:
```sh terminal icon="terminal" theme={"theme":{"light":"github-light","dark":"dracula"}}
BUN_OPTIONS="--cpu-prof-md" bun script.js
```
### Options
```sh terminal icon="terminal" theme={"theme":{"light":"github-light","dark":"dracula"}}
bun --cpu-prof --cpu-prof-name my-profile.cpuprofile script.js
bun --cpu-prof --cpu-prof-dir ./profiles script.js
```
| Flag | Description |
| ---------------------------- | ----------------------------------------------------------- |
| `--cpu-prof` | Generate a `.cpuprofile` JSON file (Chrome DevTools format) |
| `--cpu-prof-md` | Generate a markdown CPU profile (grep/LLM-friendly) |
| `--cpu-prof-name ` | Set output filename |
| `--cpu-prof-dir ` | Set output directory |
## Heap profiling
Generate heap snapshots on exit to analyze memory usage and find memory leaks.
```sh terminal icon="terminal" theme={"theme":{"light":"github-light","dark":"dracula"}}
bun --heap-prof script.js
```
`--heap-prof` writes a V8 `.heapsnapshot` file you can load in Chrome DevTools (Memory tab → Load).
### Markdown output
Use `--heap-prof-md` to generate a markdown heap profile for CLI analysis:
```sh terminal icon="terminal" theme={"theme":{"light":"github-light","dark":"dracula"}}
bun --heap-prof-md script.js
```
If both `--heap-prof` and `--heap-prof-md` are specified, the markdown format is used.
### Options
```sh terminal icon="terminal" theme={"theme":{"light":"github-light","dark":"dracula"}}
bun --heap-prof --heap-prof-name my-snapshot.heapsnapshot script.js
bun --heap-prof --heap-prof-dir ./profiles script.js
```
| Flag | Description |
| ----------------------------- | ------------------------------------------ |
| `--heap-prof` | Generate a V8 `.heapsnapshot` file on exit |
| `--heap-prof-md` | Generate a markdown heap profile on exit |
| `--heap-prof-name ` | Set output filename |
| `--heap-prof-dir ` | Set output directory |
> The [web debugger](/runtime/debugger#inspect) timeline also tracks the memory usage of the running debug session.
### Native heap stats
Bun uses mimalloc for the other heap. To print a summary of non-JavaScript memory usage on exit, set the `MIMALLOC_SHOW_STATS=1` environment variable.
```sh terminal icon="terminal" theme={"theme":{"light":"github-light","dark":"dracula"}}
MIMALLOC_SHOW_STATS=1 bun script.js
```
```txt theme={"theme":{"light":"github-light","dark":"dracula"}}
heap stats: peak total freed current unit count
reserved: 64.0 MiB 64.0 MiB 0 64.0 MiB not all freed!
committed: 64.0 MiB 64.0 MiB 0 64.0 MiB not all freed!
reset: 0 0 0 0 ok
touched: 128.5 KiB 128.5 KiB 5.4 MiB -5.3 MiB ok
segments: 1 1 0 1 not all freed!
-abandoned: 0 0 0 0 ok
-cached: 0 0 0 0 ok
pages: 0 0 53 -53 ok
-abandoned: 0 0 0 0 ok
-extended: 0
-noretire: 0
mmaps: 0
commits: 0
threads: 0 0 0 0 ok
searches: 0.0 avg
numa nodes: 1
elapsed: 0.068 s
process: user: 0.061 s, system: 0.014 s, faults: 0, rss: 57.4 MiB, commit: 64.0 MiB
```
## CPU profiling
Profile JavaScript execution to identify performance bottlenecks with the `--cpu-prof` flag.
```sh terminal icon="terminal" theme={"theme":{"light":"github-light","dark":"dracula"}}
bun --cpu-prof script.js
```
`--cpu-prof` writes a `.cpuprofile` file you can open in Chrome DevTools (Performance tab → Load profile) or VS Code's CPU profiler.
### Markdown output
Use `--cpu-prof-md` to generate a markdown CPU profile, which is grep-friendly and designed for LLM analysis:
```sh terminal icon="terminal" theme={"theme":{"light":"github-light","dark":"dracula"}}
bun --cpu-prof-md script.js
```
Combine `--cpu-prof` and `--cpu-prof-md` to generate both formats at once:
```sh terminal icon="terminal" theme={"theme":{"light":"github-light","dark":"dracula"}}
bun --cpu-prof --cpu-prof-md script.js
```
You can also pass the flag through the `BUN_OPTIONS` environment variable:
```sh terminal icon="terminal" theme={"theme":{"light":"github-light","dark":"dracula"}}
BUN_OPTIONS="--cpu-prof-md" bun script.js
```
### Options
```sh terminal icon="terminal" theme={"theme":{"light":"github-light","dark":"dracula"}}
bun --cpu-prof --cpu-prof-name my-profile.cpuprofile script.js
bun --cpu-prof --cpu-prof-dir ./profiles script.js
```
| Flag | Description |
| ---------------------------- | ----------------------------------------------------------- |
| `--cpu-prof` | Generate a `.cpuprofile` JSON file (Chrome DevTools format) |
| `--cpu-prof-md` | Generate a markdown CPU profile (grep/LLM-friendly) |
| `--cpu-prof-name ` | Set output filename |
| `--cpu-prof-dir ` | Set output directory |
## Heap profiling
Generate heap snapshots on exit to analyze memory usage and find memory leaks.
```sh terminal icon="terminal" theme={"theme":{"light":"github-light","dark":"dracula"}}
bun --heap-prof script.js
```
`--heap-prof` writes a V8 `.heapsnapshot` file you can load in Chrome DevTools (Memory tab → Load).
### Markdown output
Use `--heap-prof-md` to generate a markdown heap profile for CLI analysis:
```sh terminal icon="terminal" theme={"theme":{"light":"github-light","dark":"dracula"}}
bun --heap-prof-md script.js
```
If both `--heap-prof` and `--heap-prof-md` are specified, the markdown format is used.
### Options
```sh terminal icon="terminal" theme={"theme":{"light":"github-light","dark":"dracula"}}
bun --heap-prof --heap-prof-name my-snapshot.heapsnapshot script.js
bun --heap-prof --heap-prof-dir ./profiles script.js
```
| Flag | Description |
| ----------------------------- | ------------------------------------------ |
| `--heap-prof` | Generate a V8 `.heapsnapshot` file on exit |
| `--heap-prof-md` | Generate a markdown heap profile on exit |
| `--heap-prof-name ` | Set output filename |
| `--heap-prof-dir ` | Set output directory |