> ## Documentation Index
> Fetch the complete documentation index at: https://bun-1dd33a4e-farm-ad2450b3-transpiler-cache-version-namespa.mintlify.site/llms.txt
> Use this file to discover all available pages before exploring further.
# Debugging
> Debug your Bun code with an interactive debugger using WebKit Inspector Protocol
Bun speaks the [WebKit Inspector Protocol](https://github.com/oven-sh/bun/blob/main/packages/bun-inspector-protocol/src/protocol/jsc/index.d.ts), so you can debug your code with an interactive debugger. For demonstration purposes, consider the following web server.
## Debugging JavaScript and TypeScript
```typescript icon="https://mintcdn.com/bun-1dd33a4e-farm-ad2450b3-transpiler-cache-version-namespa/pVrMBuZvntvIe2NO/icons/typescript.svg?fit=max&auto=format&n=pVrMBuZvntvIe2NO&q=85&s=81fcaf3ac2cead5d758f3588a492f46a" title="server.ts" theme={"theme":{"light":"github-light","dark":"dracula"}}
Bun.serve({
fetch(req) {
console.log(req.url);
return new Response("Hello, world!");
},
});
```
### `--inspect`
To enable debugging when running code with Bun, use the `--inspect` flag. This starts a WebSocket server on an available port for introspecting the running Bun process.
```sh icon="terminal" title="terminal" theme={"theme":{"light":"github-light","dark":"dracula"}}
bun --inspect server.ts
```
```txt id="terminal" theme={"theme":{"light":"github-light","dark":"dracula"}}
------------------ Bun Inspector ------------------
Listening at:
ws://localhost:6499/0tqxs9exrgrm
Inspect in browser:
https://debug.bun.sh/#localhost:6499/0tqxs9exrgrm
------------------ Bun Inspector ------------------
```
### `--inspect-brk`
The `--inspect-brk` flag behaves identically to `--inspect`, except it injects a breakpoint at the first line of the executed script. Use it to debug scripts that run quickly and exit immediately.
### `--inspect-wait`
The `--inspect-wait` flag behaves identically to `--inspect`, except the code does not execute until a debugger attaches to the running process.
### Setting a port or URL for the debugger
Regardless of which flag you use, you can specify a port number, URL prefix, or both.
```sh icon="terminal" title="terminal" theme={"theme":{"light":"github-light","dark":"dracula"}}
bun --inspect=4000 server.ts
bun --inspect=localhost:4000 server.ts
bun --inspect=localhost:4000/prefix server.ts
```
***
## Debuggers
Several debugging tools can connect to this server.
### `debug.bun.sh`
Bun hosts a web-based debugger at [debug.bun.sh](https://debug.bun.sh). It is a modified version of WebKit's [Web Inspector Interface](https://webkit.org/web-inspector/web-inspector-interface/), which looks familiar to Safari users.
Open the provided `debug.bun.sh` URL in your browser to start a debugging session. From this interface, you can view the source code of the running file, view and set breakpoints, and execute code with the built-in console.
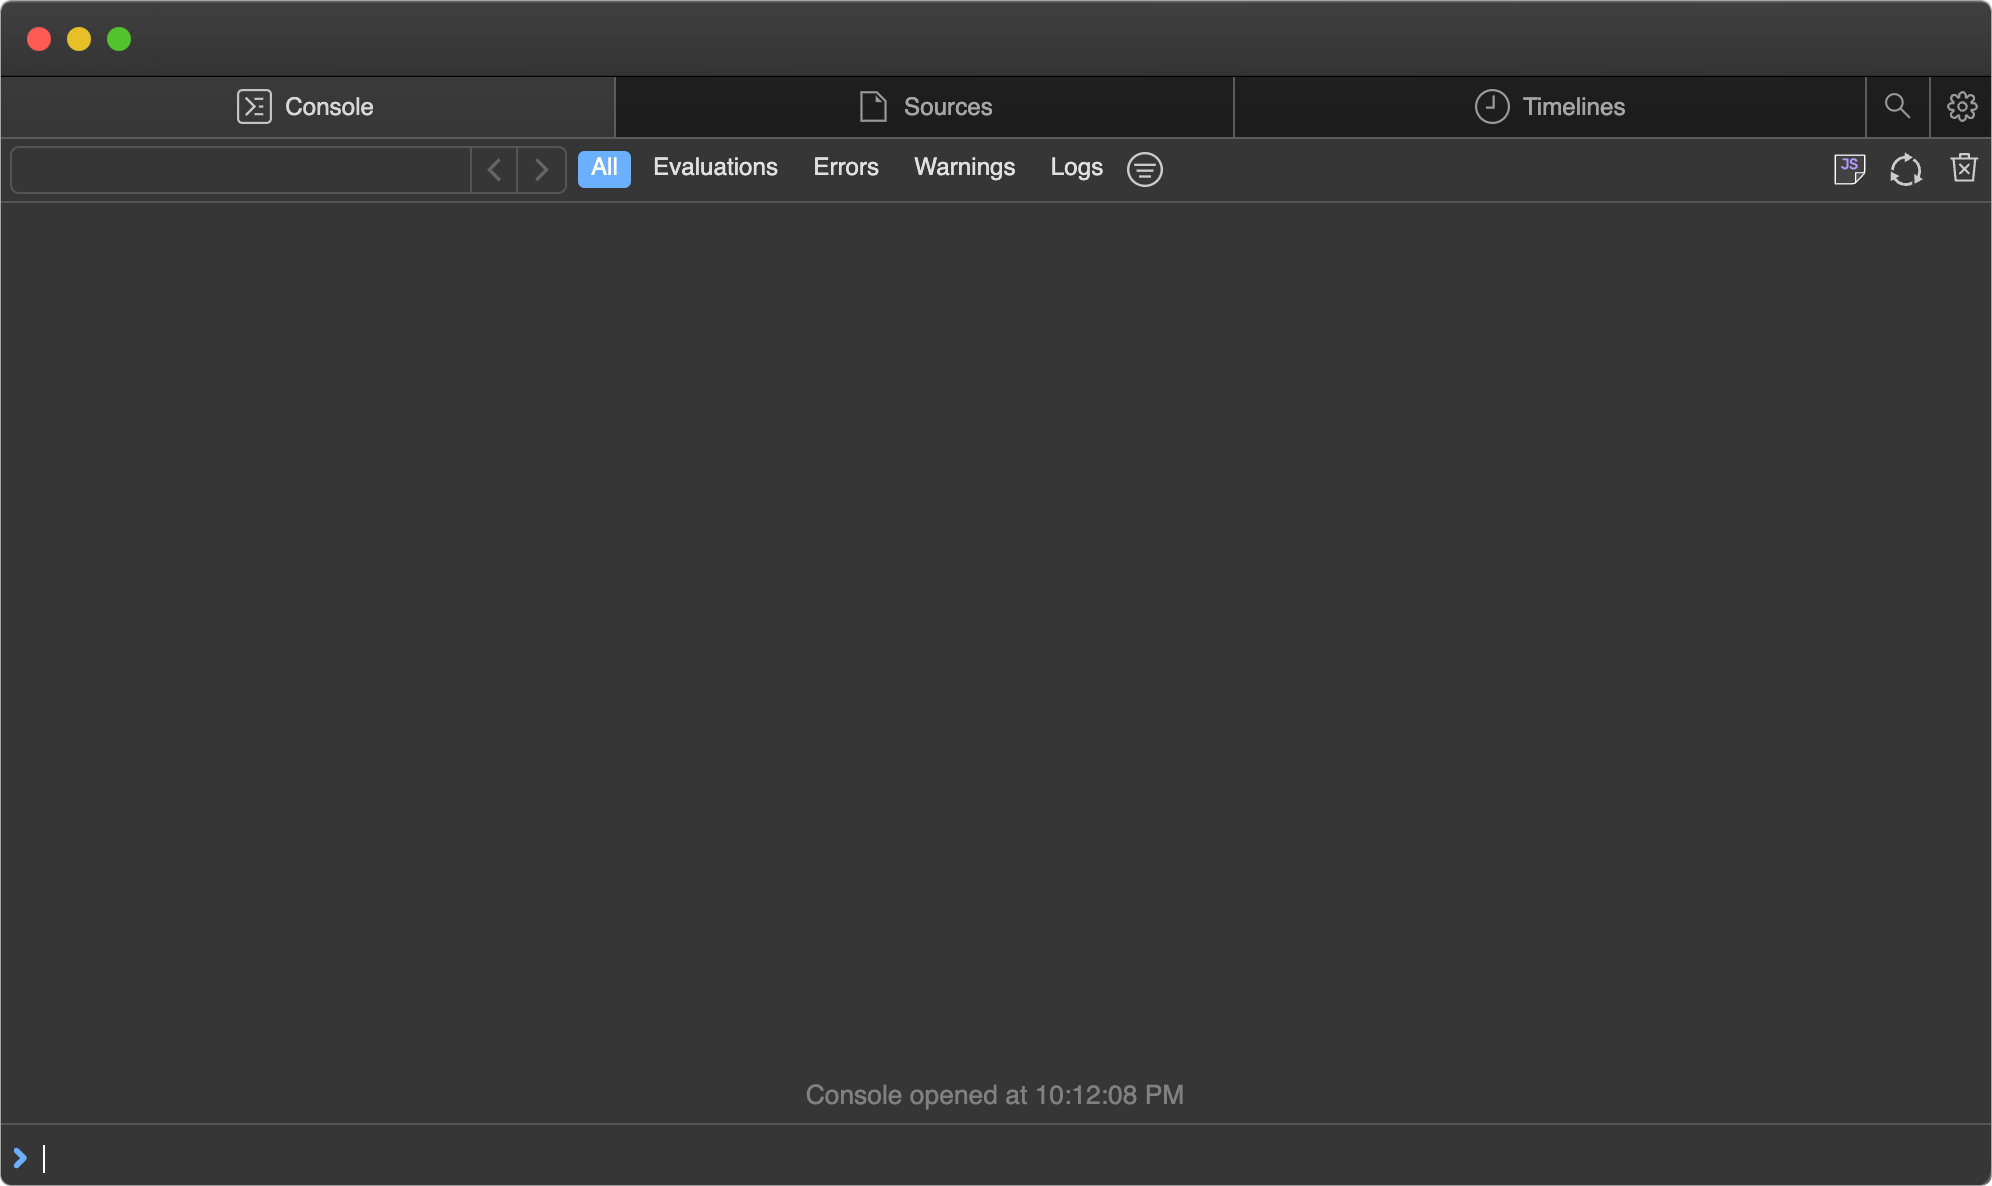
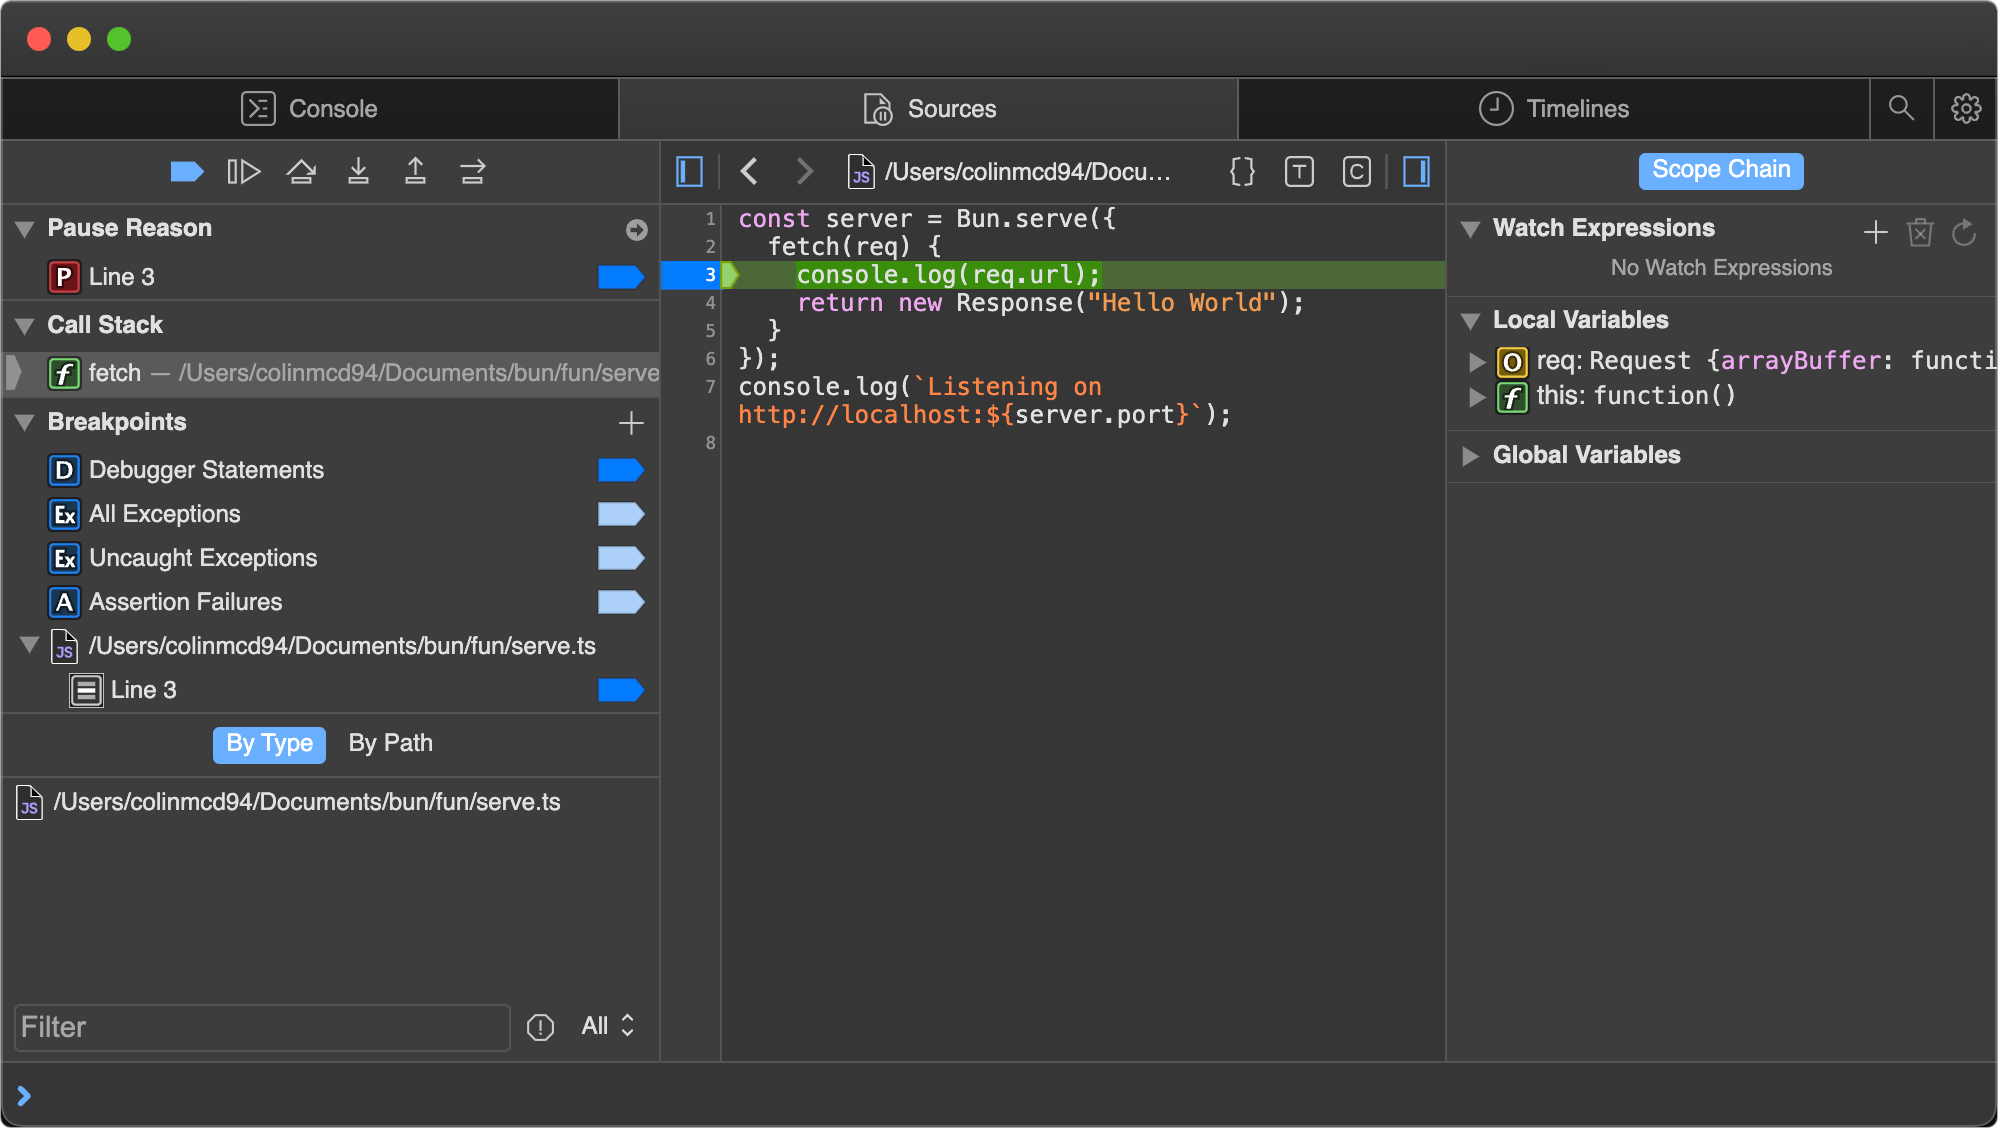
Open the Sources tab; you should see the code from earlier. Click line number `3` to set a breakpoint on the `console.log(req.url)` statement.

Then visit [`http://localhost:3000`](http://localhost:3000) in your web browser. The page never finishes loading because the program has paused at the breakpoint.
Note how the UI has changed.
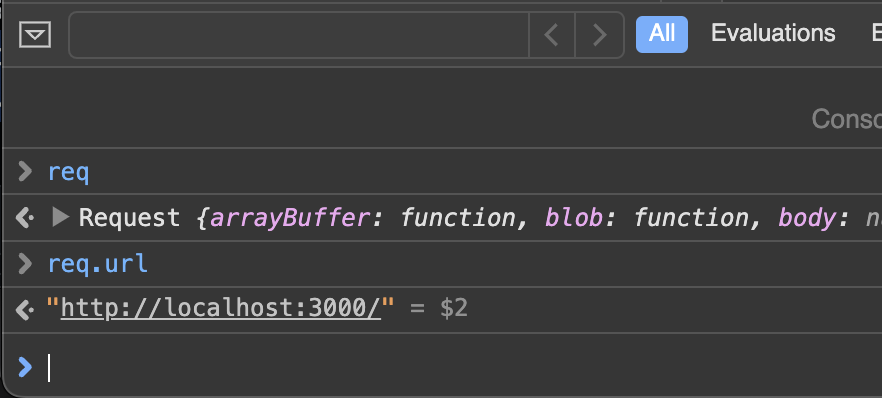
While paused, use the console at the bottom to run arbitrary code in the context of the program, with full access to the variables in scope at the breakpoint.
The right side of the Sources pane lists all local variables currently in scope. Drill into one, like `req` here, to see its properties and methods.

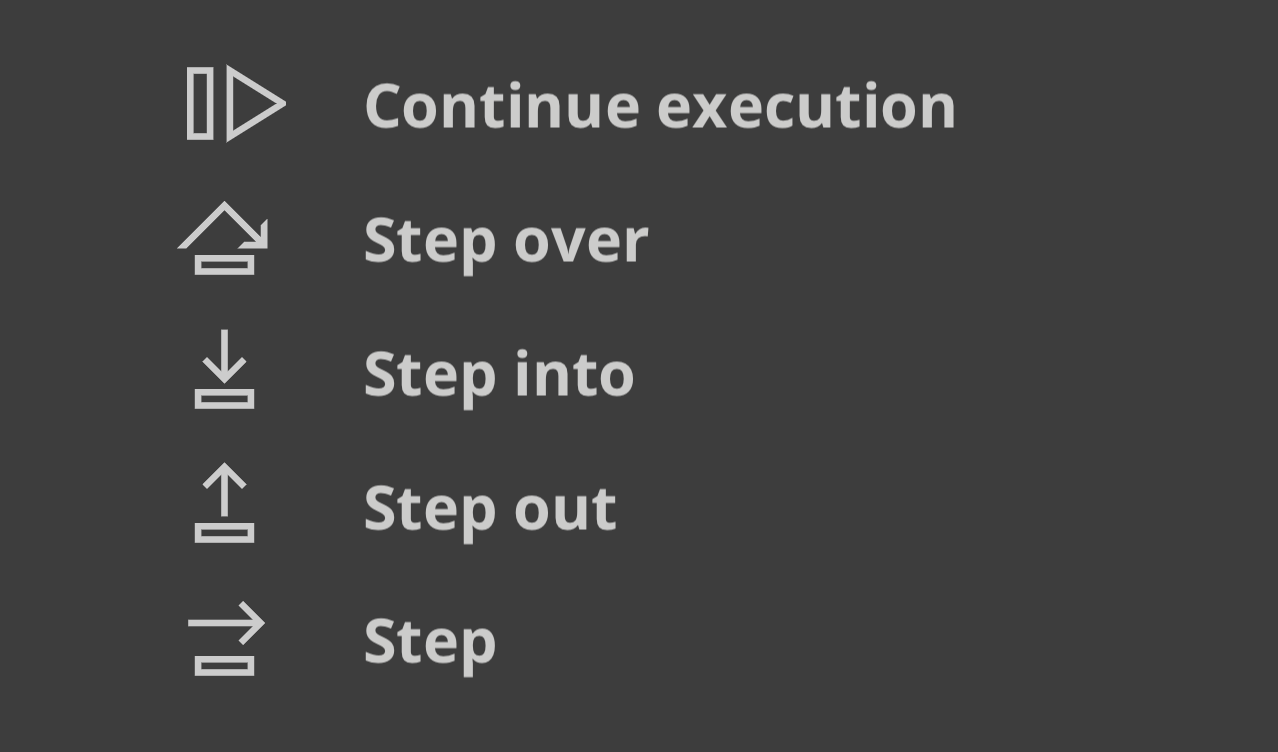
The controls in the upper left of the Sources pane drive the program's execution.

What each button does:
* *Continue script execution* — run until the next breakpoint or exception.
* *Step over* — advance to the next line.
* *Step into* — if the current statement contains a function call, enter the called function.
* *Step out* — if the current statement is a function call, finish executing it, then return to the location where it was called.
### Visual Studio Code Debugger
Visual Studio Code support for debugging Bun scripts is experimental. To use it, install the [Bun VSCode extension](/guides/runtime/vscode-debugger).
***
## Debugging Network Requests
Set the `BUN_CONFIG_VERBOSE_FETCH` environment variable to log network requests made with `fetch()` or `node:http`.
| Value | Description |
| ------- | --------------------------------- |
| `curl` | Print requests as `curl` commands |
| `true` | Print request & response info |
| `false` | Don't print anything (default) |
### Print fetch & node:http requests as curl commands
Set `BUN_CONFIG_VERBOSE_FETCH` to `curl` to print each `fetch()` and `node:http` request as a single-line `curl` command you can copy-paste into your terminal to replicate the request.
```ts index.ts icon="https://mintcdn.com/bun-1dd33a4e-farm-ad2450b3-transpiler-cache-version-namespa/pVrMBuZvntvIe2NO/icons/typescript.svg?fit=max&auto=format&n=pVrMBuZvntvIe2NO&q=85&s=81fcaf3ac2cead5d758f3588a492f46a" theme={"theme":{"light":"github-light","dark":"dracula"}}
process.env.BUN_CONFIG_VERBOSE_FETCH = "curl";
await fetch("https://example.com", {
method: "POST",
headers: {
"Content-Type": "application/json",
},
body: JSON.stringify({ foo: "bar" }),
});
```
```txt theme={"theme":{"light":"github-light","dark":"dracula"}}
[fetch] $ curl --http1.1 "https://example.com/" -X POST -H "content-type: application/json" -H "Connection: keep-alive" -H "User-Agent: Bun/1.3.3" -H "Accept: */*" -H "Host: example.com" -H "Accept-Encoding: gzip, deflate, br" --compressed -H "Content-Length: 13" --data-raw "{\"foo\":\"bar\"}"
[fetch] > HTTP/1.1 POST https://example.com/
[fetch] > content-type: application/json
[fetch] > Connection: keep-alive
[fetch] > User-Agent: Bun/1.3.3
[fetch] > Accept: */*
[fetch] > Host: example.com
[fetch] > Accept-Encoding: gzip, deflate, br
[fetch] > Content-Length: 13
[fetch] < 200 OK
[fetch] < Accept-Ranges: bytes
[fetch] < Cache-Control: max-age=604800
[fetch] < Content-Type: text/html; charset=UTF-8
[fetch] < Date: Tue, 18 Jun 2024 05:12:07 GMT
[fetch] < Etag: "3147526947"
[fetch] < Expires: Tue, 25 Jun 2024 05:12:07 GMT
[fetch] < Last-Modified: Thu, 17 Oct 2019 07:18:26 GMT
[fetch] < Server: EOS (vny/044F)
[fetch] < Content-Length: 1256
```
The lines with `[fetch] >` are the request from your local code, and the lines with `[fetch] <` are the response from the remote server.
To print without the `curl` command, set `BUN_CONFIG_VERBOSE_FETCH` to `true`.
```ts index.ts icon="https://mintcdn.com/bun-1dd33a4e-farm-ad2450b3-transpiler-cache-version-namespa/pVrMBuZvntvIe2NO/icons/typescript.svg?fit=max&auto=format&n=pVrMBuZvntvIe2NO&q=85&s=81fcaf3ac2cead5d758f3588a492f46a" theme={"theme":{"light":"github-light","dark":"dracula"}}
process.env.BUN_CONFIG_VERBOSE_FETCH = "true";
await fetch("https://example.com", {
method: "POST",
headers: {
"Content-Type": "application/json",
},
body: JSON.stringify({ foo: "bar" }),
});
```
```txt theme={"theme":{"light":"github-light","dark":"dracula"}}
[fetch] > HTTP/1.1 POST https://example.com/
[fetch] > content-type: application/json
[fetch] > Connection: keep-alive
[fetch] > User-Agent: Bun/1.3.3
[fetch] > Accept: */*
[fetch] > Host: example.com
[fetch] > Accept-Encoding: gzip, deflate, br
[fetch] > Content-Length: 13
[fetch] < 200 OK
[fetch] < Accept-Ranges: bytes
[fetch] < Cache-Control: max-age=604800
[fetch] < Content-Type: text/html; charset=UTF-8
[fetch] < Date: Tue, 18 Jun 2024 05:12:07 GMT
[fetch] < Etag: "3147526947"
[fetch] < Expires: Tue, 25 Jun 2024 05:12:07 GMT
[fetch] < Last-Modified: Thu, 17 Oct 2019 07:18:26 GMT
[fetch] < Server: EOS (vny/044F)
[fetch] < Content-Length: 1256
```
***
## Stacktraces & sourcemaps
Bun transpiles every file, which could leave stack traces pointing at the transpiled output. To avoid this, Bun generates and serves sourcemapped files for every file it transpiles. When you see a stack trace in the console, you can click on the file path and land in the original source code, even though it was written in TypeScript or JSX, or has some other transformation applied.
Bun loads sourcemaps both at runtime when transpiling files on-demand, and when using `bun build` to precompile files ahead of time.
### Syntax-highlighted source code preview
Bun prints a small source-code preview when an unhandled exception or rejection occurs. To produce the same output yourself, call `Bun.inspect(error)`:
```ts theme={"theme":{"light":"github-light","dark":"dracula"}}
// Create an error
const err = new Error("Something went wrong");
console.log(Bun.inspect(err, { colors: true }));
```
The output is a syntax-highlighted preview of the source code where the error occurred, along with the error message and stack trace.
```ts icon="file-code" theme={"theme":{"light":"github-light","dark":"dracula"}}
1 | // Create an error
2 | const err = new Error("Something went wrong");
^
error: Something went wrong
at file.js:2:13
```
### V8 Stack Traces
Bun uses JavaScriptCore as its engine, but much of the Node.js ecosystem and npm expects V8, and JavaScript engines differ in how they format `error.stack`. Because Bun aims to be a drop-in replacement for Node.js, it formats `error.stack` the same way V8 does. This matters most when you use libraries that expect V8 stack traces.
#### V8 Stack Trace API
Bun implements the [V8 Stack Trace API](https://v8.dev/docs/stack-trace-api), a set of functions for manipulating stack traces.
##### `Error.prepareStackTrace`
Define a global `Error.prepareStackTrace` function to customize the stack trace output. It receives the error object and an array of `CallSite` objects, and its return value becomes `error.stack`.
```ts theme={"theme":{"light":"github-light","dark":"dracula"}}
Error.prepareStackTrace = (err, stack) => {
return stack.map(callSite => {
return callSite.getFileName();
});
};
const err = new Error("Something went wrong");
console.log(err.stack);
// [ "error.js" ]
```
The `CallSite` object has the following methods:
| Method | Returns |
| -------------------------- | ----------------------------------------------------- |
| `getThis` | `this` value of the function call |
| `getTypeName` | typeof `this` |
| `getFunction` | function object |
| `getFunctionName` | function name as a string |
| `getMethodName` | method name as a string |
| `getFileName` | file name or URL |
| `getLineNumber` | line number |
| `getColumnNumber` | column number |
| `getEvalOrigin` | `undefined` |
| `getScriptNameOrSourceURL` | source URL |
| `isToplevel` | returns `true` if the function is in the global scope |
| `isEval` | returns `true` if the function is an `eval` call |
| `isNative` | returns `true` if the function is native |
| `isConstructor` | returns `true` if the function is a constructor |
| `isAsync` | returns `true` if the function is `async` |
| `isPromiseAll` | Not implemented yet. |
| `getPromiseIndex` | Not implemented yet. |
| `toString` | returns a string representation of the call site |
If the `Function` object has already been garbage collected, some of these methods return `undefined`.
##### `Error.captureStackTrace(error, startFn)`
`Error.captureStackTrace` captures a stack trace at a specific point in your code, rather than at the point where the error was thrown.
This helps when callbacks or asynchronous code make it hard to tell where an error originated. The 2nd argument to `Error.captureStackTrace` is the function where you want the stack trace to start.
In the following example, `err.stack` points to the code calling `fn()`, even though the error was thrown at `myInner`.
```ts index.ts icon="https://mintcdn.com/bun-1dd33a4e-farm-ad2450b3-transpiler-cache-version-namespa/pVrMBuZvntvIe2NO/icons/typescript.svg?fit=max&auto=format&n=pVrMBuZvntvIe2NO&q=85&s=81fcaf3ac2cead5d758f3588a492f46a" theme={"theme":{"light":"github-light","dark":"dracula"}}
const fn = () => {
function myInner() {
throw err;
}
try {
myInner();
} catch (err) {
console.log(err.stack);
console.log("");
console.log("-- captureStackTrace --");
console.log("");
Error.captureStackTrace(err, fn);
console.log(err.stack);
}
};
fn();
```
```txt theme={"theme":{"light":"github-light","dark":"dracula"}}
Error: here!
at myInner (file.js:4:15)
at fn (file.js:8:5)
at module code (file.js:17:1)
at moduleEvaluation (native)
at moduleEvaluation (native)
at (native)
-- captureStackTrace --
Error: here!
at module code (file.js:17:1)
at moduleEvaluation (native)
at moduleEvaluation (native)
at (native)
```